
A week of agent work leaves enough local evidence to answer concrete questions: when sessions were active, which provider produced the activity, which models appeared, and how the token mix changed by day.
Current coverage: Agent Island 2.1.2 supports Claude Code, Codex, Antigravity, Grok, and Cursor — live session state and your-turn alerts for all five, on macOS and Windows.
The same data cannot prove that the code was correct, that the week was productive, or that an API-value estimate was money spent. A weekly report is useful when it keeps those boundaries visible.
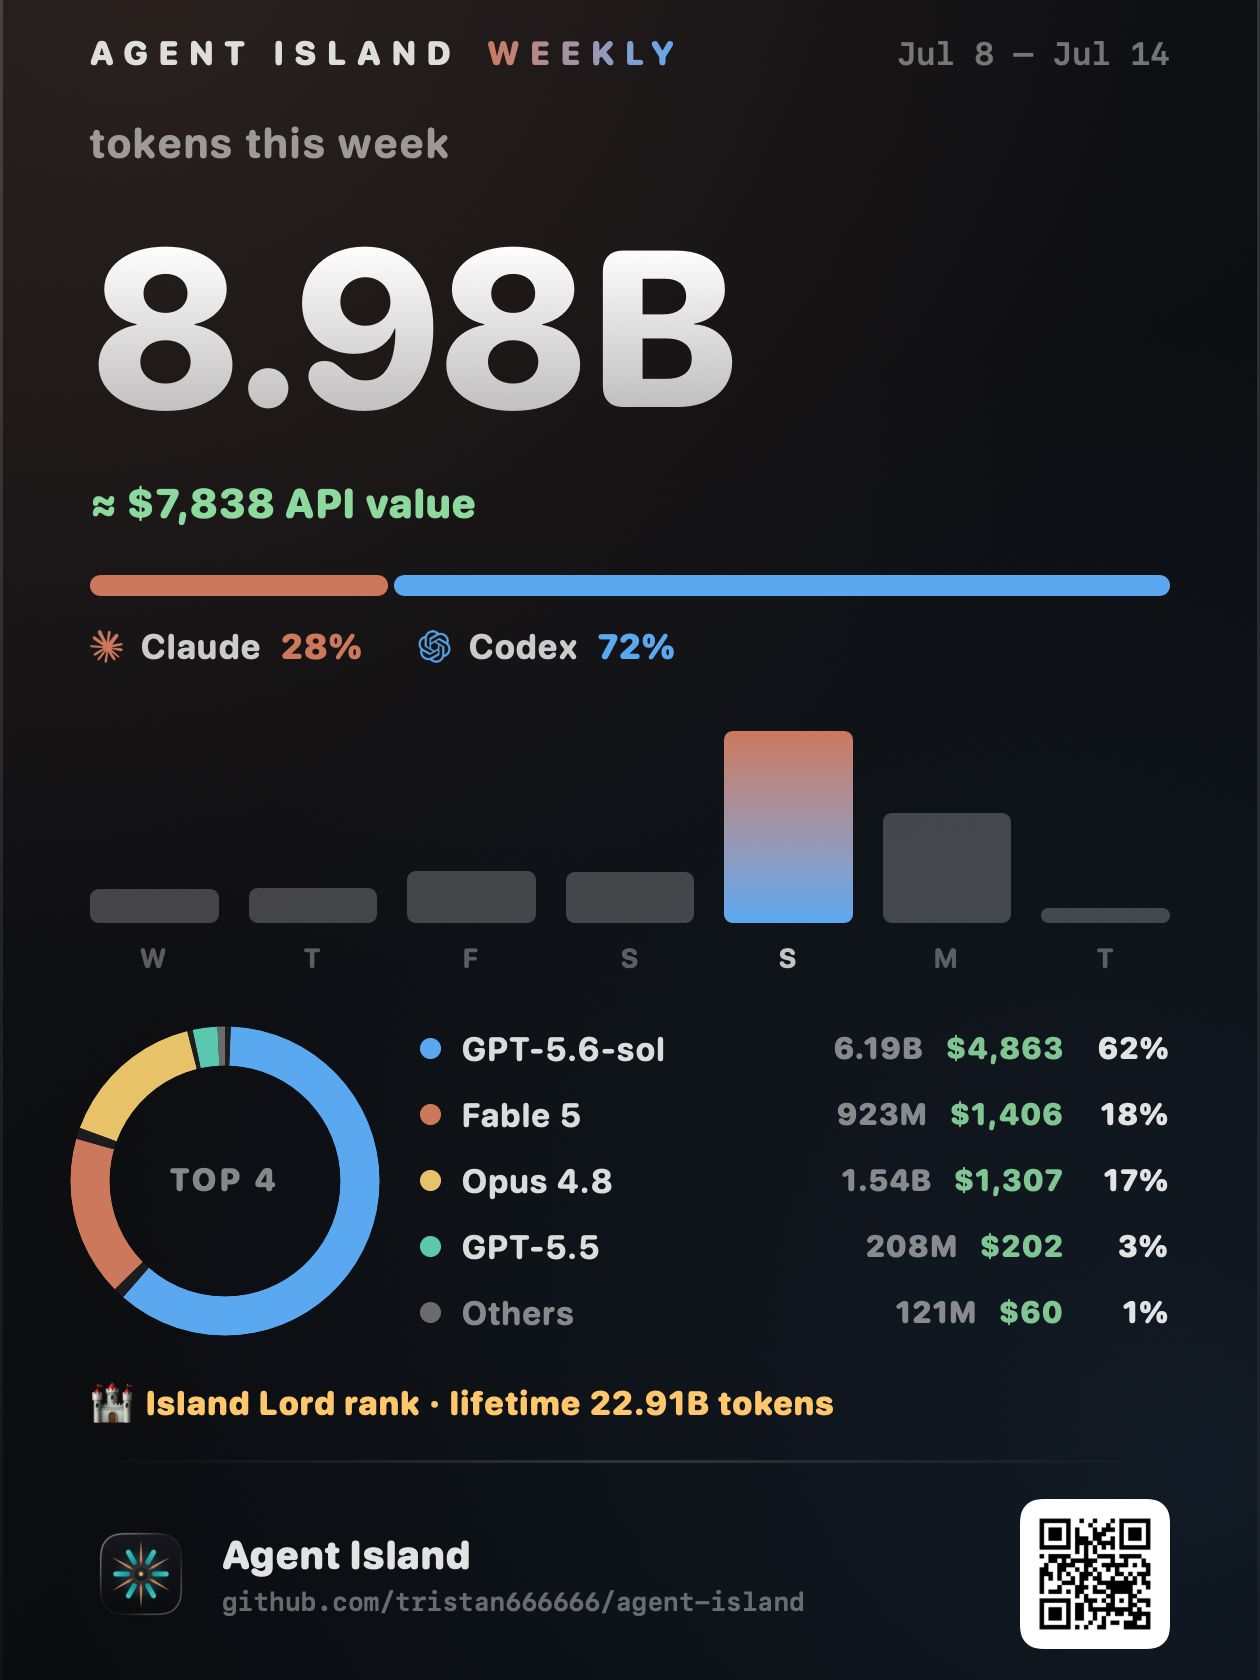
1. Use calendar days, not a drifting 168-hour window
A readable weekly report should use today plus the previous six local calendar days. Daily bars, provider totals, model rows, and the headline must share that exact boundary.
Mixing a calendar chart with rolling model totals can produce rows that exceed the headline. Timezone handling and midnight boundaries are accounting rules, not visual polish.
2. Read token totals as activity
Input, output, cache creation, and cache reads describe different work. A wire-token total can show how much activity appeared in local records, while an input/output total can exclude cache traffic for a narrower view.
Neither number is a productivity score. A cache-heavy refactor can move more tokens than a small but important fix. A failed run can be expensive. A quiet session can be waiting for a person rather than accomplishing nothing.
3. Compare providers without inventing equivalence
A provider split can show how much recorded activity came from Claude Code and how much came from Codex. It should not imply that one token from each provider represents equal work, latency, quality, or quota pressure.
Quota windows remain provider-reported state. Local token activity remains a reconstructed ledger. The report can display both, but it should not use one to fill missing values in the other.
4. Treat model rows as a dated inventory
Model names can change during a session. Each token event should retain the model context active when it occurred. Unknown model identifiers should remain visible rather than inheriting a guessed price.
Ranking by estimated API value and ranking by token volume answer different questions. A model with many inexpensive cache reads can lead by tokens while another leads by value.
5. Run a five-minute weekly review
- Check whether all seven local days are present.
- Look for unexplained gaps, replay spikes, or provider freshness errors.
- Compare provider and model mix without treating either as quality.
- Use the estimate only under its displayed price-table date.
- Write one operational change for the next week, such as reducing unattended runs or checking a recurring authentication failure.
The final step is where the report becomes useful. The number alone does not improve a workflow; a specific decision does.
6. Keep sharing separate from collection
Agent Island builds its local report from session records already stored on the machine. Transcript content is not uploaded to an Agent Island service, and no Agent Island account is required.
A shareable card is a rendered summary, not an automatic broadcast. Copying or exporting it is an explicit action. Before sharing any report, review the visible model names, dates, totals, and project context for information you do not want to disclose.
Current verified scope
The weekly report and sharing behavior described here is verified on macOS in Agent Island v1.7.1. Agent Island also ships on Windows, but this page does not claim the same report-card surface there without current UI verification.
Read the local ledger engineering notes or audit the AI coding cost tracker measurement contract.
← All posts